Last update: July 12th, 2021
From now on it is possible to display the observations of a weather station from the BMCB network in real time on your website.
The widget will automatically update every ±10 minutes. The update of the data happens between the 1st and 2nd minute after the start of the 10-minute window, between minute 1 and 2, 11 and 12, 21 and 22, etc… This spreading in time is done to keep the load on the server balanced and thus keep the browsing experience good when requesting other pages.
You will therefore always see the latest observations. When you hover the mouse over a certain parameter, a pop-up appears in plain text which correctly displays what that number is showing.
The widget uses an “iframe”. An “iframe” allows displaying another web page within the web page. That “other web page” is our widget…
What are the options for configuring the widget to match your website as perfectly as possible? Some parameters must be present, others can be chosen freely (if you are satisfied with the default values).
An example of the HTML code of a web page with one widget can be found below:
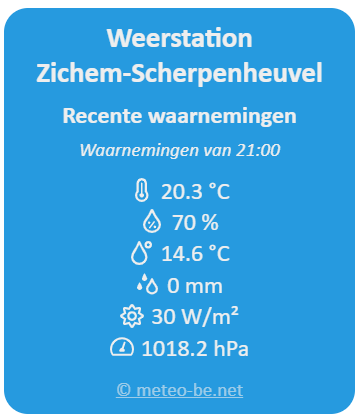
| <!DOCTYPE html> <html> <body> <iframe src="https://meteo-be.net/widget/v1/zichem-scherpenheuvel?l=nl&f=temperature;humidity;dewpoint;rain_amount;irradiation;pressure&s=background:rgb(38,154,223);font:gudea,sans-serif&o=shortStation&tb=Recente%20waarnemingen" width="250" height="350" frameborder="0"> </iframe> </body> </html> |
The iframe itself consists of the URL to the widget (src=), as well as a parameter “width” that specifies the width of the iframe and the “height” for its height. If the numbers associated with the parameters are too small, scroll bars will be displayed, which is obviously not the intention. Increasing the numbers until these bars disappear is the solution. The frameborder="0" parameter ensures that no borders are visible from the iframe.
We'll focus on part of the <iframe>, the piece of code that links to the widget, shown above in orange. Respect small and large (capital) letters !
- The URL (src=) always starts with “https://meteo-be.net/widget/v1/” and is concatenated everywhere without any space in between and is enclosed in double quotes. Don't be fooled by the fact that this URL is displayed on several lines (by the browser or editor), in reality this is 1 long line of text.
- The name of the weather station:
- The widget can only show data from 1 weather station. If you want to show multiple stations, multiple widgets must be created.
- You can see where the stations of the BMCB network are located on, for example, the map of Belgium (menu “Weather” / “Map”)
- The name in the URL should match the station name you see in the address bar when you click on the appropriate station on the map. In our example, this is “zichem-scherpenheuvel”. You must always use the full name !
- After the station name comes a question mark “?”
- The language of the widget:
Example: “l=en” to display the widget in English- “nl” for Dutch
- “fr” for French
- “en” for English
- The list of parameters, period and aggregates to be displayed (= sum or total, the average, the minimum, the maximum).
The parameters are displayed in the widget in the order as defined in the URL. The list of parameters is preceded by “&f=”
The sequence is period:aggregate:parameter
Note that the three items are separated by a colon “:”
If the period is “the past 10 minutes” - that's the most recent data available at that time - then only the parameter has to be stated (after all, aggregates do not apply here since it only concerns 1 period of 10 minutes).
Also note that all values refer to time slots of 10 minutes! A single observation is a 10 minute period and that period has an average temperature, a minimum temperature and a maximum temperature. Same rule applies to irradiation and irradiation_max, and also wind and wind_speed_high. Do not forget…- the possible parameters in the URL are (certain stations only have a subset available, e.g. the wind! refer to the maps what kind of parameters are available for each weather station):
- “temperature” for the average temperature
- “temperature_min” for the minimum temperature
- "temperature_max" for the maximum temperature
- “dewpoint” for the dew point temperature
- “humidity” for the relative humidity
- “pressure” for the air pressure at sea level
- “rain_amount” for the rainfall amount
- “irradiation” for the average solar radiation
- “irradiation_max” for maximum solar radiation
- “wind” for the average wind speed and wind direction
- “wind_speed_high” for the maximum wind gust
- the possible periods are:
- “day” is from the beginning of the current day at 00:00 local time
- “last_12h” is the past 12 hours
- “last_24h” is the last 24 hours
- “last_30d” is the past 30 days (present to 720 hours back in time)
- “week” is the current week (starting the week on Monday 00:00 LT)
- “month” since the beginning of this month 00:00 local time
- the default value is the previous period of 10 minutes
- the possible aggregates are:
- “sum” for the sum of the values in the specified period
- “average” for the average value of all data in the specified period
- “min” for the lowest value of all data in the specified period
- “max” for the highest value of all data in the specified period
- some examples:
- today's minimum temperature since 00:00 local time
“day:min:temperature_min”
note that we take the minimum of all minimum values (= temperature_min) that occurred in the 10min time slots. - the maximum temperature since the beginning of the month
“day:max:temperature_max”
note that we are taking the maximum of all maximum values (= temperature_max) that occurred in the 10min time slots. - the total precipitation fallen this month (till now)
“month:sum:rain_amount” - the total solar radiation we have already received today.
“day:sum:irradiation”
- today's minimum temperature since 00:00 local time
- examples for multiple parameters in the widget:
- the parameter groups (= group of period:aggregate:parameter) are separated by a semicolon “;”
- for example:
you want a widget containing the actual temperature and also the minimum and maximum temperature of the day since midnight: "temperature;day:min:temperature_min;day:max:temperature_max"
note that there is no semicolon at the end of the whole list! If you add one, an error will be generated.
- the possible parameters in the URL are (certain stations only have a subset available, e.g. the wind! refer to the maps what kind of parameters are available for each weather station):
- The style of the widget
- If something is changed to the style, the “&s=” must be applied beforehand
- Multiple style items must be separated by a semicolon “;”
- The background color of the widget
- “background:gray”
- “background:rgb(128,128,128)"
- “background:rgb(50%,50%,50%)”
- "background:rgba(0,0,0,0.2)"
You can choose from a predefined color (in our example middle gray “gray”), or specify any color with rgb values or specify rgb values and transparency (rgba). You will find the color names (supported by all browsers) on this link and you will also immediately see how the color looks on the screen…
- The text color used in the widget
This is done in the same way as changing the background color, for example “text:rgb(255,255,255)” makes the text white - Change the color of the icons
This is done in the same way as changing the background color, for example “iconColor:rgb(0,0,255)” makes the icons blue - The text font used
Use “font:sans-serif” (where sans-serif is the fontname) to change the font; you can specify multiple fonts by separating them with a comma, for example “font:arial,verdana,sans-serif”; a font with a name that consists of several parts should be placed in single quotes, as for example in 'Segoe UI'. - The size of the font
To do this, use “fontSize:120%” to adjust the font size. Default value is 100%.
- Other options
- No station name
- By default, the station name is shown preceded by “Weather Station”. If it is completely clear about which location it is, you can choose not to have the name appear in the widget by using the option “&o=noStation”
- The word “Weather Station” will therefore not appear as the first line of text in the widget. If you still want to see this, you can add it as a free text field.
- Short station name
- Default the long station name is shown, some examples are: Westouter (Heuvelland), Kluizen (Evergem), Recht (Sankt-Vith)
- You can limit the station name to the first part - in the above examples: “Westouter” or “Kluizen” or “Recht” - and omit the part in brackets by using the option “&o=shortStation"
- Above in our example, Zichem-Scherpenheuvel is still shown because Scherpenheuvel is not in parentheses.
- Suppressing the time of the last data update
- Default is shown the time of the most recent data “Update from xx:xx”.
- You can suppress this text line by passing the option “&o=noTime”.
- You can choose not to show icons but readable text.
- Please note: sometimes that the textstring is long and the widget will look terrible…
- to replace the icons with text, use the option “&o=text”.
- If you have more than 1 option, you can combine them with a semicolon “;” between them, for example: “&o=shortStation;noTime”.
- Insert additional free text lines
- Bold Text : use “&tb=Free%20Bold%20Text”
- Note that the free text must be converted to URI-encoded text (this replaces special punctuation marks with codes as in the example where %20 represents a space);
- you can do this encoding at the following location: https://meyerweb.com/eric/tools/dencoder/
- Plain Text : is identical to the bold text described above, but now use “&t=” instead of “&tb=”.
- Multiple lines of free text can be used, both bold and normal. All lines of bold text appear in the widget first (in the order of definition), then the free normal text (also in the order of the definition in the URL).
The free text lines appear in the widget just above the parameters / observations.
- Bold Text : use “&tb=Free%20Bold%20Text”
- Link to a specific webpage
- When you click in the widget, you (default) go to the relevant station page on meteo-be.net / meteo.vlaanderen.
- You can change this default page to a specific page by means of the “&u=https%3A%2F%2Fmeteo-be.net%2F” where the part after “=” is the encoded URL;
- to encode the URL use the same link as above. In our example, a link is made to https://meteo-be.net/
- No station name
Examples of widgets can be found on this page…